How often is 1st January a Monday?
Published:
Answer…less often than every other day except Saturday. I have no idea why.
Yesterday, 1st January 2018 was a Monday. Monday is the first day of the week. Some people think Sunday is the first day of the week. I don’t understand those people.
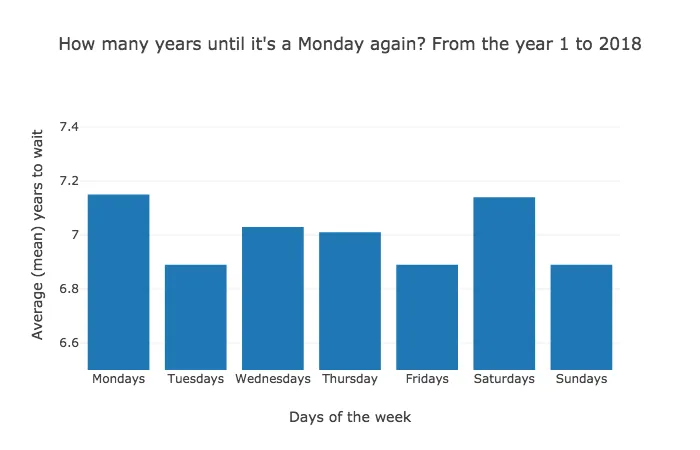
Anyway, it made me wonder…How often has the first day of the week been the first day of the year? And how many years will we have to wait until the first day of the year is a Monday again?
I wrote some bad, repetitive Python code (also on Github) to work this out. I also made some bad, repetitive use of the Plotly Python Library to make some bar charts.
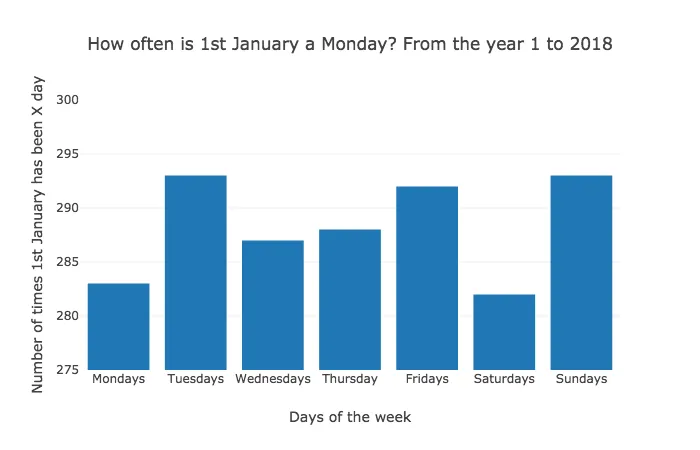
For some reason, 1st January doesn’t spread evenly among all the days of the week. One in 7 is 14.29%. 1st January is a Monday or Saturday 14% of the time; Wednesday or Thursday 14.25% of the time; and Tuesday, Friday or Sunday 14.5% of the time.
From the year 1 AD to 2018
| Day of week | Times 1st Jan has been X day | Avg years to wait |
|---|---|---|
| Monday | 283 | 7.15 |
| Tuesday | 293 | 6.89 |
| Wednesday | 287 | 7.03 |
| Thursday | 288 | 7.01 |
| Friday | 292 | 6.89 |
| Saturday | 282 | 7.14 |
| Sunday | 293 | 6.89 |
These are the number of times 1st January has fallen on X day of the week since the year 1 AD (the earliest year Python can work with in its standard library). It also shows the mean average number of years we have to wait from 1st January being X day of the week until the next time it happens.
There are three groupings of frequency of 1st January being X day of the week.
- Tuesdays (293 since the year 1 AD), Fridays (292) and Sundays (293) — 14.51%
- Wednesdays (287) and Thursdays (288)
- Mondays (283) and Saturdays (282)
Somebody (else) probably has an explanation for why this happens.
The next time 1st January is a Monday is 2024 (in 6 years). The previous time was 2007 (11 years ago).
 ]
]
 ]
]
From the year 1 AD to 9999
To test that a bit further I tried it from 1AD to the year 9999 as well. (9999 is the maximum year Python can work with in its standard library.) The results are as good as exactly the same.
| Day of week | Times 1st Jan has been X day | Avg years to wait |
|---|---|---|
| Monday | 1400 | 7.14 |
| Tuesday | 1450 | 6.89 |
| Wednesday | 1425 | 7.02 |
| Thursday | 1425 | 7.02 |
| Friday | 1450 | 6.89 |
| Saturday | 1399 | 7.15 |
| Sunday | 1450 | 6.89 |
And just to check that there’s no change over time in how often a 1st January is X day of the week…
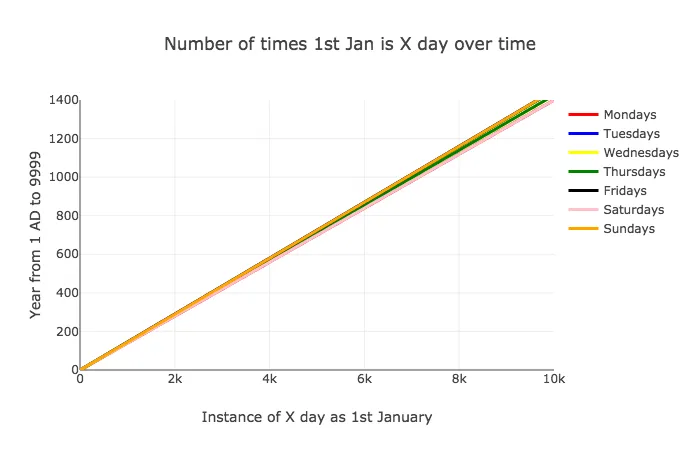
There’s no change over time in the rate of X day of the week being 1st January. (The days in the original three groupings overlap.)
That bad, repetitive Python
In case you want to work with this here’s that bad, repetitive code I used. It’s also on Github.
    from datetime import datetime
    from statistics import mean
    import plotly
    import plotly.graph_objs as go

    # year = int(datetime.today().strftime("%Y"))  # 2018 at the moment
    year = 9999  # the latest year you can use


    def get_first_jan_weekdays(year):
        mondays = []  # "2018, 2007, 2001"
        tuesdays = []
        wednesdays = []
        thursdays = []
        fridays = []
        saturdays = []
        sundays = []

        while year >= 1:
            day_of_week_first_jan = datetime(year, 1, 1).strftime("%A")

            if day_of_week_first_jan == 'Monday':
                mondays.append(year)
            elif day_of_week_first_jan == 'Tuesday':
                tuesdays.append(year)
            elif day_of_week_first_jan == 'Wednesday':
                wednesdays.append(year)
            elif day_of_week_first_jan == 'Thursday':
                thursdays.append(year)
            elif day_of_week_first_jan == 'Friday':
                fridays.append(year)
            elif day_of_week_first_jan == 'Saturday':
                saturdays.append(year)
            elif day_of_week_first_jan == 'Sunday':
                sundays.append(year)

            year -= 1

        return mondays, tuesdays, wednesdays, thursdays, fridays, saturdays, sundays


    def first_jans_over_time(mondays, tuesdays, wednesdays, thursdays, fridays,
                                saturdays, sundays):
        mondays_over_time = sorted(mondays)
        tuesdays_over_time = sorted(tuesdays)
        wednesdays_over_time = sorted(wednesdays)
        thursdays_over_time = sorted(thursdays)
        fridays_over_time = sorted(fridays)
        saturdays_over_time = sorted(saturdays)
        sundays_over_time = sorted(sundays)

        return mondays_over_time, tuesdays_over_time, wednesdays_over_time, thursdays_over_time, fridays_over_time, saturdays_over_time, sundays_over_time


    def get_number_of_first_jan_weekdays(mondays, tuesdays, wednesdays, thursdays,
                                            fridays, saturdays, sundays):
        total_mondays = len(mondays)
        total_tuesdays = len(tuesdays)
        total_wednesdays = len(wednesdays)
        total_thursdays = len(thursdays)
        total_fridays = len(fridays)
        total_saturdays = len(saturdays)
        total_sundays = len(sundays)

        return total_mondays, total_tuesdays, total_wednesdays, total_thursdays, total_fridays, total_saturdays, total_sundays


    def get_avg_wait_between_years(mondays, tuesdays, wednesdays, thursdays,
                                    fridays, saturdays, sundays):
        # 1st num minus 2nd num
        mon_waits = [s - t for s, t in zip(mondays, mondays[1:])]
        # mean difference rounded to 2 decimal places
        mon_avg_wait = round(mean(mon_waits), 2)

        tues_waits = [s - t for s, t in zip(tuesdays, tuesdays[1:])]
        tues_avg_wait = round(mean(tues_waits), 2)

        wed_waits = [s - t for s, t in zip(wednesdays, wednesdays[1:])]
        wed_avg_wait = round(mean(wed_waits), 2)

        thurs_waits = [s - t for s, t in zip(thursdays, thursdays[1:])]
        thurs_avg_wait = round(mean(thurs_waits), 2)

        fri_waits = [s - t for s, t in zip(fridays, fridays[1:])]
        fri_avg_wait = round(mean(fri_waits), 2)

        sat_waits = [s - t for s, t in zip(saturdays, saturdays[1:])]
        sat_avg_wait = round(mean(sat_waits), 2)

        sun_waits = [s - t for s, t in zip(sundays, sundays[1:])]
        sun_avg_wait = round(mean(sun_waits), 2)

        return mon_avg_wait, tues_avg_wait, wed_avg_wait, thurs_avg_wait, fri_avg_wait, sat_avg_wait, sun_avg_wait


    def generate_first_jan_over_time_line_chart(*args):

        trace0 = go.Scatter(
            x=mondays_over_time, name='Mondays', line=dict(color=('red'), width=3))

        trace1 = go.Scatter(
            x=tuesdays_over_time,
            name='Tuesdays',
            line=dict(color=('blue'), width=3))

        trace2 = go.Scatter(
            x=wednesdays_over_time,
            name='Wednesdays',
            line=dict(color=('yellow'), width=3))

        trace3 = go.Scatter(
            x=thursdays_over_time,
            name='Thursdays',
            line=dict(color=('green'), width=3))

        trace4 = go.Scatter(
            x=fridays_over_time,
            name='Fridays',
            line=dict(color=('black'), width=3))

        trace5 = go.Scatter(
            x=saturdays_over_time,
            name='Saturdays',
            line=dict(color=('pink'), width=3))

        trace6 = go.Scatter(
            x=sundays_over_time,
            name='Sundays',
            line=dict(color=('orange'), width=3))

        data = [trace0, trace1, trace2, trace3, trace4, trace5, trace6]

        layout = go.Layout(
            title="Number of times 1st Jan is X day over time",
            xaxis=dict(title="Instance of X day as 1st January", range=[0, 10001]),
            yaxis=dict(title="Year from 1 AD to 9999", range=[0, 1400]),
        )

        plotly.offline.plot({"data": data, "layout": layout})


    def generate_totals_bar_chart(*args):
        y_axis_data = []
        for arg in args:
            y_axis_data.append(arg)

        data = [
            go.Bar(
                x=[
                    "Mondays", "Tuesdays", "Wednesdays", "Thursday", "Fridays",
                    "Saturdays", "Sundays"
                ],
                y=y_axis_data)
        ]

        layout = go.Layout(
            title="How often is 1st January a Monday? From the year 1 to 9999",
            xaxis=dict(title="Days of the week"),
            yaxis=dict(
                title="Number of times 1st January has been X day",
                range=[1350, 1460]),
        )

        plotly.offline.plot({"data": data, "layout": layout})


    def generate_avgs_barchart(*args):
        y_axis_data = []
        for arg in args:
            y_axis_data.append(arg)

        data = [
            go.Bar(
                x=[
                    "Mondays", "Tuesdays", "Wednesdays", "Thursday", "Fridays",
                    "Saturdays", "Sundays"
                ],
                y=y_axis_data)
        ]

        layout = go.Layout(
            title=
            "How many years until it's a Monday again? From the year 1 to 9999",
            xaxis=dict(title="Days of the week"),
            yaxis=dict(title="Average (mean) years to wait", range=[6.5, 7.5]),
        )

        plotly.offline.plot({"data": data, "layout": layout})


    mondays, tuesdays, wednesdays, thursdays, fridays, saturdays, sundays = get_first_jan_weekdays(
        year)

    total_mondays, total_tuesdays, total_wednesdays, total_thursdays, total_fridays, total_saturdays, total_sundays = get_number_of_first_jan_weekdays(
        mondays, tuesdays, wednesdays, thursdays, fridays, saturdays, sundays)

    mon_avg_wait, tues_avg_wait, wed_avg_wait, thurs_avg_wait, fri_avg_wait, sat_avg_wait, sun_avg_wait = get_avg_wait_between_years(
        mondays, tuesdays, wednesdays, thursdays, fridays, saturdays, sundays)

    mondays_over_time, tuesdays_over_time, wednesdays_over_time, thursdays_over_time, fridays_over_time, saturdays_over_time, sundays_over_time = first_jans_over_time(
        mondays, tuesdays, wednesdays, thursdays, fridays, saturdays, sundays)

    # generate_totals_bar_chart(total_mondays, total_tuesdays, total_wednesdays, total_thursdays, total_fridays, total_saturdays, total_sundays)

    # generate_avgs_barchart(mon_avg_wait, tues_avg_wait, wed_avg_wait, thurs_avg_wait, fri_avg_wait, sat_avg_wait, sun_avg_wait)

    # generate_first_jan_over_time_line_chart(mondays_over_time, tuesdays_over_time, wednesdays_over_time, thursdays_over_time, fridays_over_time, saturdays_over_time, sundays_over_time)